Home/Resources/Application rationalisation

Guide · Application rationalisation

How to run an application rationalisation with the TIME model

Most organisations run far more applications than they need. Application rationalisation is how you decide, with evidence, which ones to keep, invest in, replace or switch off — and the TIME model is the framework that makes those decisions defensible.
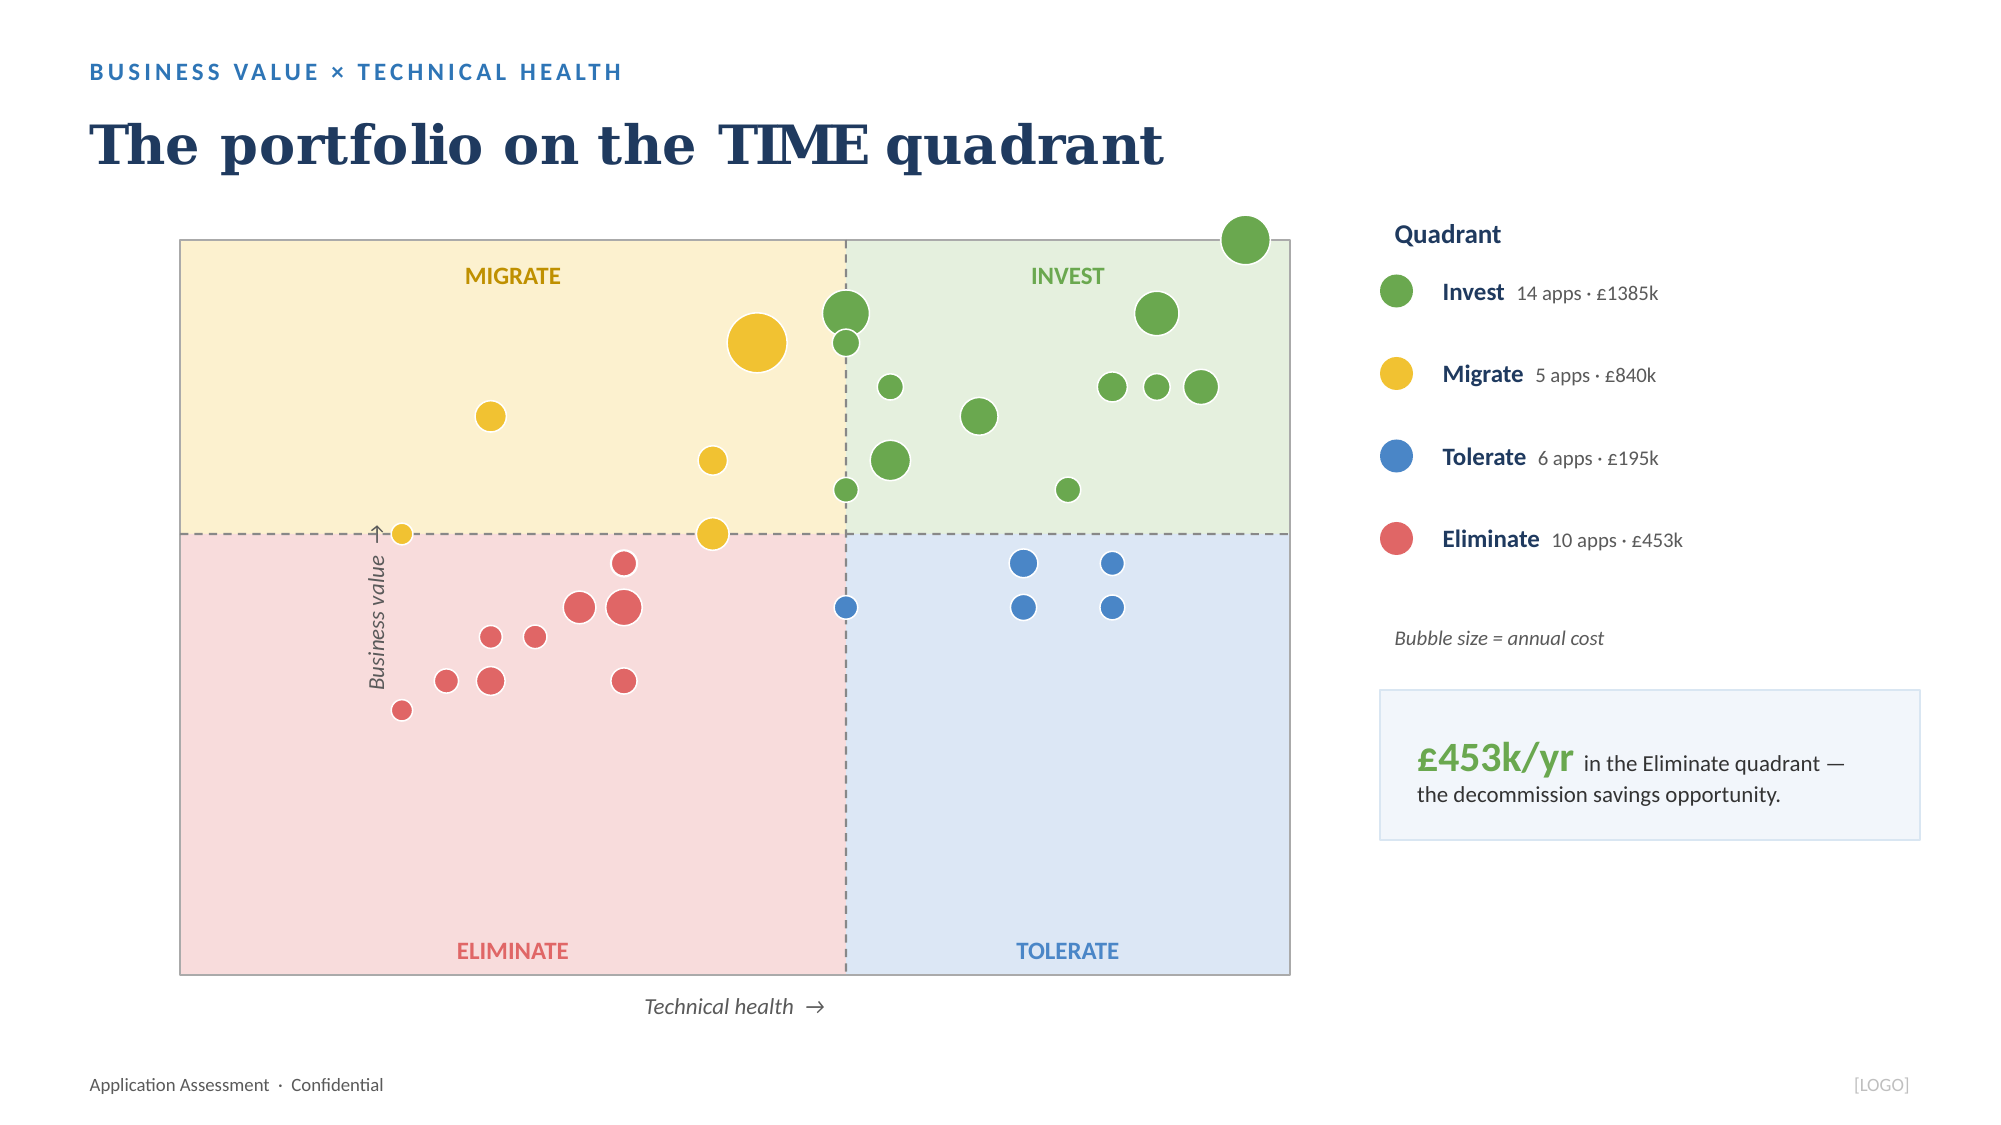
A TIME quadrant chart placing applications by business value and technical health
Every application placed on the TIME quadrant by business value and technical health.

What application rationalisation is

Application rationalisation is the process of deciding, on evidence, what to do with every application you own: keep it as is, invest in it, replace it, or switch it off.

Almost every organisation runs more applications than it needs. That is not incompetence — it is the arithmetic of a decade of individually sensible decisions, mergers that were never fully integrated, and departments that solved their own problem when central IT could not. Rationalisation is the periodic correction.

The TIME model explained

TIME sorts applications into four quadrants by plotting business value against technical quality. Its usefulness is that the quadrant implies the action.

QuadrantProfileAction
TolerateLow business value, good technical qualityLeave alone. It works and nobody needs more from it. Spend nothing beyond keeping it running
InvestHigh business value, good technical qualityEnhance. These are your strategic systems — extend them and route new demand here
MigrateHigh business value, poor technical qualityReplace or re-platform. The business depends on it and the foundations are failing. Your biggest risk
EliminateLow business value, poor technical qualityDecommission. Nobody needs it and it costs you money and risk

The quadrant that surprises people is Tolerate. Architects instinctively want to fix or remove anything unimpressive, but an application that quietly does its job at low cost deserves neither investment nor a decommissioning project. Leaving things alone is a legitimate and underused decision.

The two scoring axes

Everything rests on scoring the axes credibly, and each has to come from a different place.

Business value must be scored by the business, not by architects. Assess how critical the supported capability is to strategy, how many users depend on it, what breaks operationally without it, and whether it differentiates or is commodity. If architects score this axis alone, the analysis will be dismissed the moment it threatens something a business owner cares about.

Technical quality is scored by IT: vendor support status and version currency, architectural fit and integration burden, defect and incident rates, security posture, and how concentrated the knowledge is. A system only one contractor understands scores poorly regardless of how well it runs today.

Use a simple scale — one to five on each axis — and resist elaborate weighting on the first pass. Weighting adds the appearance of precision and rarely moves an application across a quadrant boundary.

A step-by-step process

  1. Inventory. One agreed list. See building an application inventory.
  2. Map to capabilities. Link each application to the capability it supports. Duplication becomes obvious before you score anything.
  3. Score business value with the business. Short structured sessions with owners, not a survey nobody returns.
  4. Score technical quality with IT. Technical owners, using evidence where it exists.
  5. Plot and place. Every application lands in a quadrant. Review the boundary cases explicitly — those are where judgement matters.
  6. Sequence the moves. Eliminate candidates first for early wins; Migrate candidates need proper programmes.
  7. Build the case. See the rationalisation business case.

Common pitfalls

If cloud migration is also on your agenda, see TIME vs the 6 Rs — they answer different questions and belong in sequence.

Skip the build — run it with the toolkit

The Applications Assessment & Rationalisation Toolkit gives you the scoring model, a calculator that auto-plots the TIME quadrant, a duplication workbook, an executive report and deck, and a completed 35-app worked example.

View the toolkit →