“Is our architecture governance actually working?” is a fair question — and one most practices can't answer. A small set of KPIs turns governance from a black box into something you can prove.
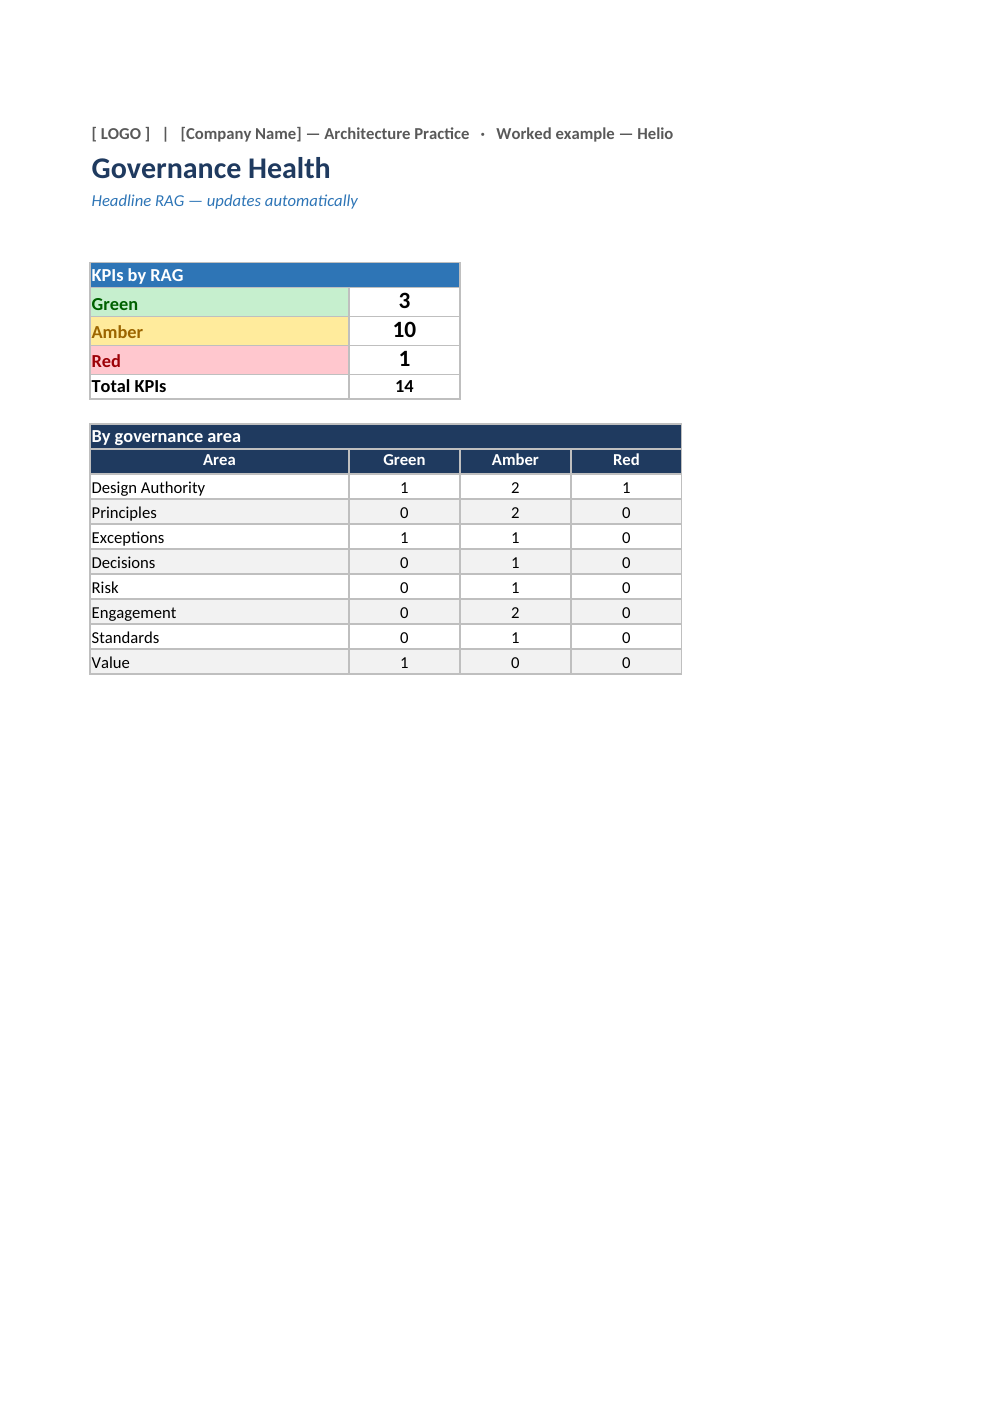
"Is our architecture governance actually working?" is a fair question, and most practices cannot answer it. They can describe the process and list the meetings, but not demonstrate that anything is better as a result.
That gap is dangerous in a specific way: functions that cannot evidence their value are the ones cut when budgets tighten. Measurement is partly about improvement and substantially about survival.
Governance KPIs fall into three families. A balanced set draws from all three, because measuring only one produces predictable distortion.
Eight to fourteen KPIs is the practical range. Fewer and you cannot see the picture; more and nobody maintains them and the pack becomes an end in itself.
Choose deliberately across the three families. A set weighted entirely to throughput will drive fast, shallow reviews. One weighted entirely to quality will produce thorough reviews that nobody can get a slot at. The balance is the point.
Every governance metric can be gamed, usually unintentionally.
| KPI | Distortion if used alone | Balance with |
|---|---|---|
| Time to decision | Rushed reviews, waved-through solutions | Decision mix, findings per review |
| Number of reviews | Trivial items pulled in to inflate volume | Coverage of qualifying projects |
| Approval rate | Either rubber-stamping or obstruction, depending which way you push it | Conditions closed on time |
| Open exceptions | Discouraging people from raising them at all | Coverage; shadow architecture discovered |
Monthly for the architecture team, quarterly for leadership. The leadership version should fit on a page and lead with the trend, not the table — three or four numbers with direction of travel, then a short narrative on what changed and what you are doing about it.
Use RAG thresholds set in advance rather than judged after the fact. A KPI that turns amber because it crossed a line you defined last quarter is credible; one that turns amber because it felt amber is not.
And report the uncomfortable ones. A pack that is entirely green is not believed by anyone who has worked in a real organisation. Showing an overdue exception count that is rising, alongside what you are doing about it, buys far more trust than showing nothing.
The Architecture Practice Setup Kit includes a governance KPI dashboard with 14 KPIs, automatic RAG and a trend chart, plus a board-ready governance pack.